MAP scores explained: RIT, percentiles, expected growth and the arithmetic behind 2.6x
NWEA's 2025 norms expect the average twelfth grader to lose 1.39 points in reading between fall and spring. A MAP Growth score is a RIT number between 100 and 350 that marks the difficulty of the questions a student gets right about half the time. It says little until it is set against those norms, which turn it into one percentile for achievement and a second for growth.
I have never given or taken a MAP test. Everything here comes from NWEA's published norms documents and help pages, plus named critics of one school's growth figures. I build Understand, a tutor for adults, and I have no connection to NWEA or to any school that uses MAP.
The RIT score
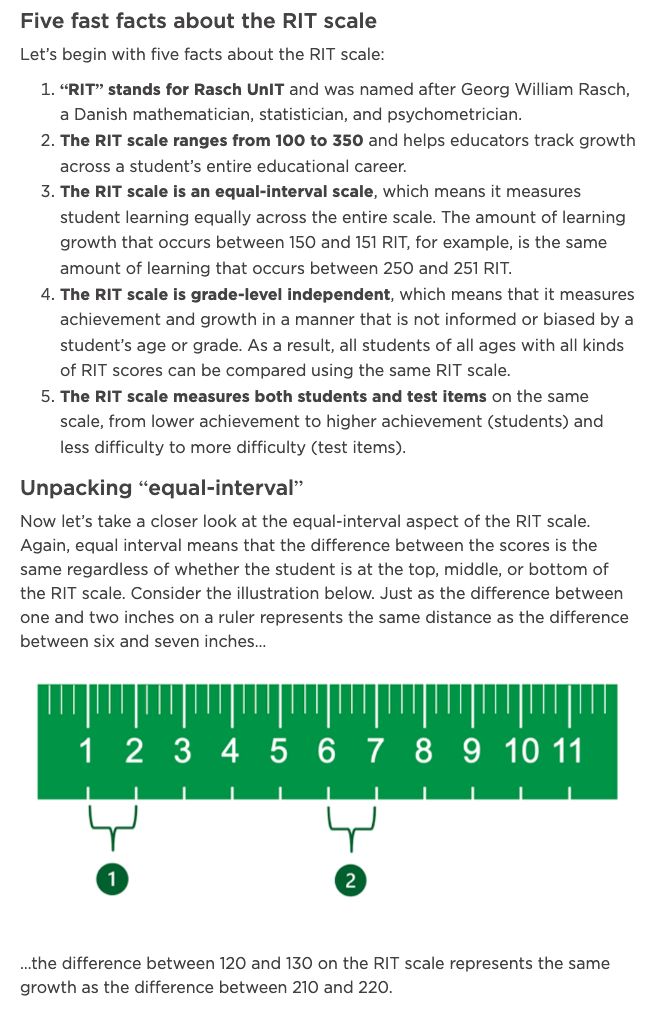
RIT is short for Rasch unit, after the Danish statistician Georg Rasch. NWEA's Jonathan Fine describes the scale as running "from 100 to 350" and as "grade-level independent", so a second grader and a tenth grader are scored on the same scale.
The test is adaptive. A right answer brings a harder question and a wrong answer an easier one, until the software has found the level where, in the words of NWEA's help page, the student "is just as likely to answer items at a particular RIT score incorrectly as they would answer them correctly". A student who comes home sure they got half the questions wrong has taken the test as designed.
NWEA's test summary gives the length for grade 2 and up as "40 to 43 questions; about 45 to 60 min". The test is untimed. The norms cover fall, winter and spring testing and assume the 4th, 20th and 32nd week of instruction.
Average scores by grade
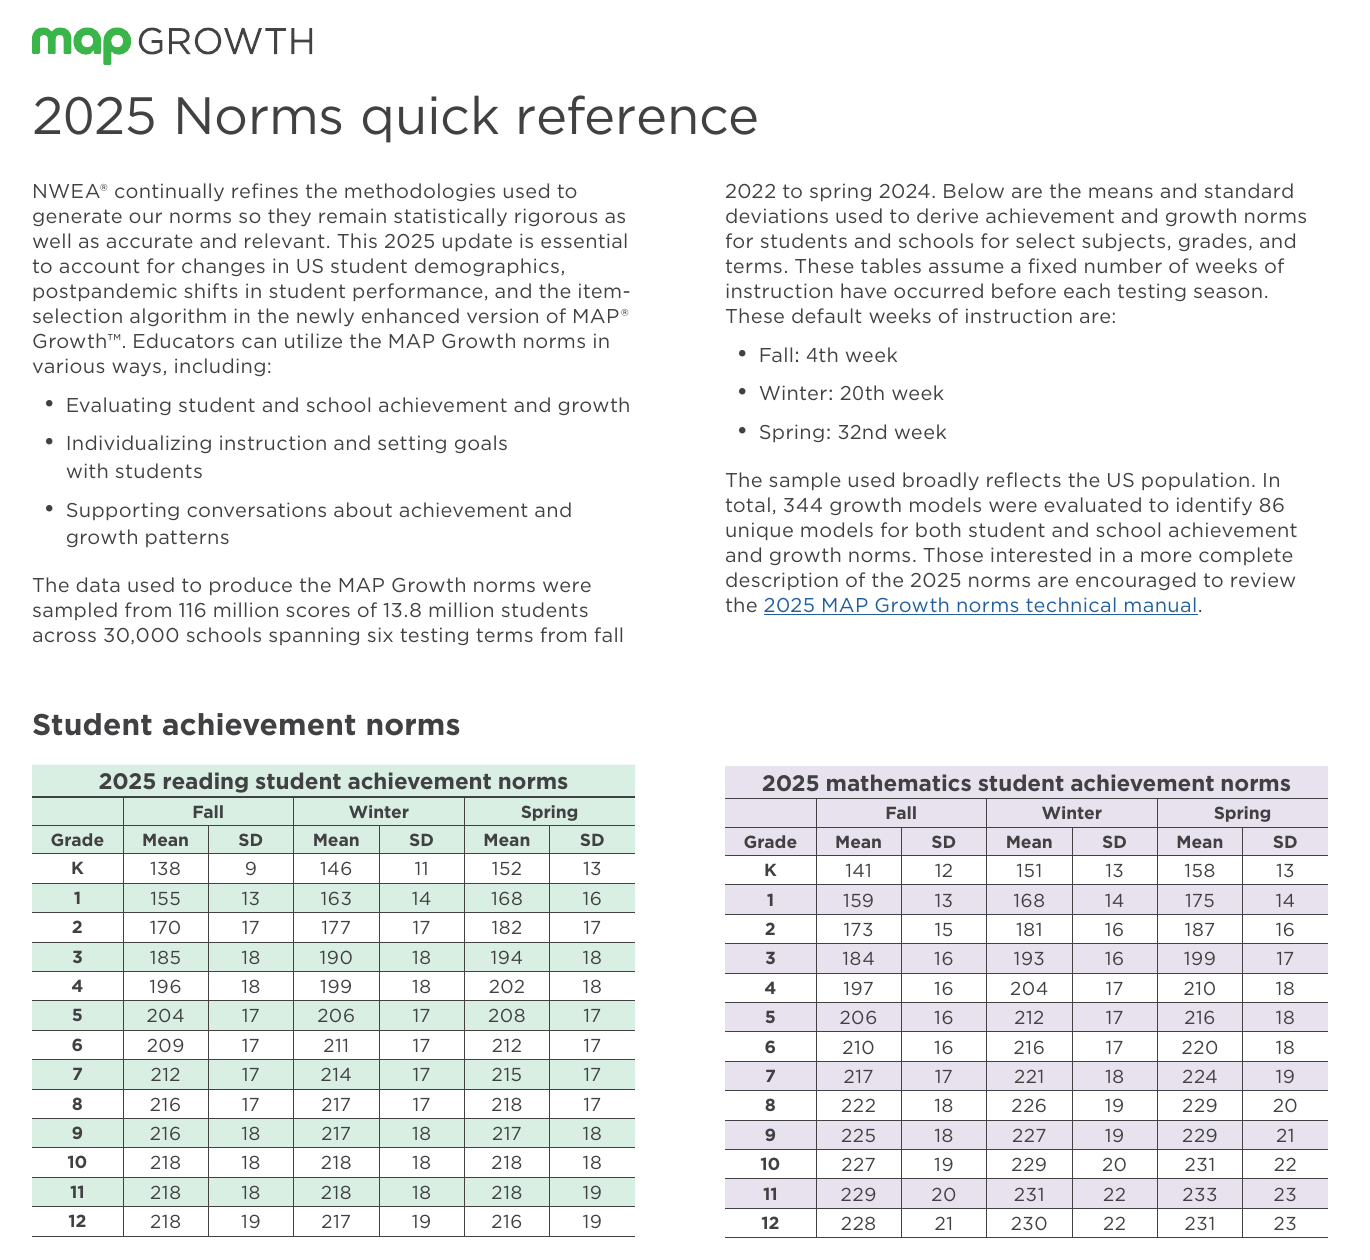
The current norms were published in 2025. NWEA's quick reference says they come from "116 million scores of 13.8 million students across 30,000 schools", tested from fall 2022 to spring 2024. The means below are from that sheet. The growth columns are the mean fall-to-spring gains in Tables C.1 and C.3 of the 2025 MAP Growth Norms Technical Manual.
| Grade | Reading, fall mean | Reading, spring mean | Reading, mean gain | Math, fall mean | Math, spring mean | Math, mean gain |
|---|---|---|---|---|---|---|
| K | 138 | 152 | 13.89 | 141 | 158 | 16.61 |
| 1 | 155 | 168 | 12.49 | 159 | 175 | 15.70 |
| 2 | 170 | 182 | 11.62 | 173 | 187 | 14.59 |
| 3 | 185 | 194 | 9.10 | 184 | 199 | 15.05 |
| 4 | 196 | 202 | 6.16 | 197 | 210 | 13.04 |
| 5 | 204 | 208 | 4.70 | 206 | 216 | 9.78 |
| 6 | 209 | 212 | 3.09 | 210 | 220 | 10.11 |
| 7 | 212 | 215 | 2.49 | 217 | 224 | 6.64 |
| 8 | 216 | 218 | 2.10 | 222 | 229 | 6.83 |
| 9 | 216 | 217 | 0.97 | 225 | 229 | 3.92 |
| 10 | 218 | 218 | 0.71 | 227 | 231 | 4.56 |
| 11 | 218 | 218 | -0.40 | 229 | 233 | 3.81 |
| 12 | 218 | 216 | -1.39 | 228 | 231 | 2.99 |
The spread inside a grade is wide. In the manual's Table B.7, a fifth grader's fall reading score is 181 at the 10th percentile, 204 at the 50th and 226 at the 90th. That gap is wider than the one between the average second grader and the average sixth grader.
A good score
NWEA's norms do not define one. The manual says: "Norms document what typically happens in student performance; they do not establish what should happen or represent achievement goals."
The 50th percentile is the average American student in that grade. Whether average is good depends on the bar. NWEA's 2020 norms study notes that many states set proficiency at a difficulty between the 60th and 70th percentile, and concludes that "the average student (50th percentile) would not meet the grade-level proficiency standards used in many states".
The percentile also depends on the year of the norms. Karyn Lewis of NWEA wrote in August 2025 that achievement fell after 2020, so "the same RIT score will now correspond to a higher percentile rank than it did under the 2020 norms". Her example is a fifth-grade reading score that moved from the 50th percentile to the 56th while the child stayed exactly as good at reading. A percentile from 2024 and one from 2026 are measured against different crowds.
Achievement percentiles and growth percentiles
The achievement percentile compares one score with same-grade students at the same point in the school year.
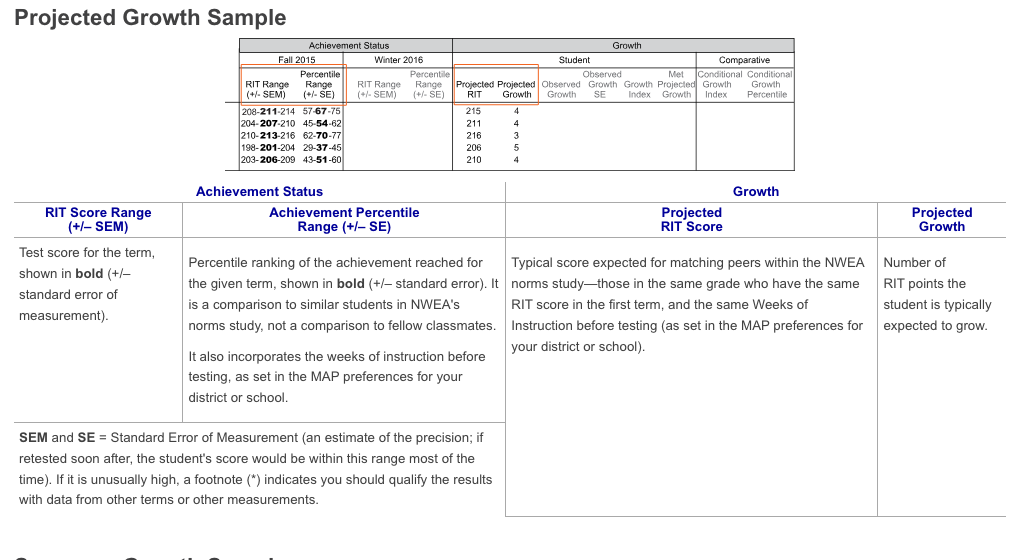
The growth percentile compares a change. NWEA's norms answer a narrower question than "did the score go up": how much did students in the same grade, with the same starting score and the same weeks of instruction, gain over the same period? The mean for that group is the projected growth on a report. NWEA's report guide describes the Conditional Growth Index as a comparison with those matching peers, where "a value of zero (0) corresponds to the mean (typical) growth", and the conditional growth percentile as the index translated to a national ranking. Equation 3.20 of the manual gives the calculation: observed gain minus expected gain, divided by the standard deviation of gains for that group.
The same guide marks the raw difference between observed and projected growth as "inappropriate for comparing students". Dividing by the standard deviation is what makes two students comparable.
Expected growth by grade and by starting score
In the table, kindergartners gain about 14 points in reading over a school year and ninth graders about one.
Expected growth also falls inside each grade as the starting score rises. NWEA's help page on growth says "students starting with a high score generally do not raise their score as much as students starting with a low score". The 2020 norms tables print this for every grade. For ninth-grade reading, fall to spring, a student starting at the 10th percentile is expected to gain 4.78 points, one at the 50th gains 2.51, and one at the 90th gains 0.23.
Part of the reason is ordinary statistics. A fall score is the student's skill plus some luck on the day, and a very high score contains more good luck than average. The luck does not repeat in spring. I found no NWEA document that says how much of the pattern this explains.
NWEA's advice to teachers: "High school students, especially those with high achievement, may have only a small growth projection. In this case, focus on the average growth across the larger group, rather than individual student growth."
Measurement error in one student's gain
Every RIT score comes with a standard error. The 2020 norms study says "a typical MAP Growth reading score has an SEM of about 3.4 points" and works an example: a fifth grader scoring 210 in fall is at the 63rd percentile, and the range of plus or minus 3.4 points runs from the 54th percentile to the 70th.
A gain is the difference of two such scores, so it carries both errors. If the two are independent they combine to the square root of 3.4 squared plus 3.4 squared, which is 4.8 points. Compare that with the table: from fourth grade on, the average reading gain for a whole school year is about 6 points or less.
NWEA's guide shows a student with observed growth of 9 points against a projection of 4 and a growth standard error of 6.4, and flags the result as in question. A single fall-to-spring gain for a single older student is mostly a statement about two test days.
From a 2-point gain to 9x growth
Alpha School's program page says its students "grow 2.6 times faster than peers on nationally normed MAP tests". I covered the school in my Alpha School review. Kelsey Piper explained the multiple in The Argument on August 25, 2026: Alpha takes each student's gain and divides it by the gain expected for that grade and starting percentile. Her first example is a median third-grade reader "expected to grow 7 points from fall to winter", so that 14 points is 2x. Her second is the one that travels:
"For example, a ninth-grade student who is a 90th-percentile reader is expected to gain only 0.23 points on the reading MAP test from fall to spring. But this means that a ninth grader gaining two points, which is within normal random variation, would count as 9x growth!"
Both of her numbers are in NWEA's 2020 norms tables. Table D.2.4 gives the third grader 7.28 points. Table D.2.10 has the ninth grader: a fall score of 243.28 at the 90th percentile and an expected gain to spring of 0.23. Alpha has not published which norms it uses, so the match with the 2020 tables is my observation.
The arithmetic, in order:
- The ratio is 2 divided by 0.23, which is 8.7. Rounded, that is 9x.
- NWEA's own measure for the same student uses the standard deviation of gains in that table, 8.03 points. The index is (2 - 0.23) / 8.03 = 0.22, which is the 59th growth percentile. Forty-one in a hundred similar students gained more, and the gain is well inside the 4.8 points of error on a difference.
- Do the same for a median third grader, whose expected fall-to-spring gain is 10.50 points with a standard deviation of 7.45. Doubling it takes 21 points, an index of 1.41 and the 92nd growth percentile.
So 2x in third grade is a result nine in ten students do not reach, and 9x in ninth grade is a result four in ten beat. The multiple has no fixed meaning, because the number underneath the fraction changes from 10.50 to 0.23 while the spread of gains stays near 8.
The 2025 norms produce odder results. The average twelfth grader's expected reading gain is -1.39, so a senior who gains 2 points has grown at -1.4x and one who loses 3 points has grown at 2.2x.
The school-wide figure adds a second step. Peter Naimoli, an Alpha parent, wrote in July 2025 that the school divides each student's growth by the median for their peers, and "then they average all those ratios to get their big '2.6x' number". Take a third grader who gains exactly the expected 10.50 points and the ninth grader above. Their ratios are 1.0 and 8.7, and the average is 4.85, which is Piper's "5x". Add the points instead: the two students gained 12.5 against an expected 10.73, which is 1.16 times.
NWEA's reports use the second method, under the name "Percent of Projected Growth Met", and still attach a warning: "One or two outliers can skew the percentage for the group." By default they also leave out summaries for groups of fewer than ten students, "because summary data for small groups is not statistically reliable". Alpha's mid-year report gives grade cohorts of 42 to 50, which clears that line. The 5x figure for its gifted school rested on five children.
None of this requires a false statement. Each division is correct, and the sentence "our students averaged 2.6 times expected growth" can be true of the ratios. It does not tell a parent that their child will learn 2.6 times as much. Naimoli, who calls 2.6 "an erroneously computed and meaningless number", also writes "I love the school" and that Alpha students do raise their MAP scores faster than students elsewhere. Piper's guess is that the gains are real where the program fits, at a size well short of 2x. She writes that Alpha did not respond before publication.
Things MAP leaves out
MAP Growth covers reading, language usage, mathematics and science. The sample questions in NWEA's RIT Reference Charts ask the student to pick an answer or drag labels into boxes. The parent whose review of Alpha appeared on Astral Codex Ten in 2025 describes the test as entirely multiple choice.
Nobody writes a paragraph. In those samples the language usage questions check grammar and mechanics by asking which option is correct, and I found no question that asks the student to explain why an answer is right or to argue a position. The test places a student on a scale in about an hour, and I think it does that well. NWEA calls it an interim assessment and tells teachers to use it "along with high-quality formative assessment".
Reading your child's report
NWEA's Family Report shows, for each subject:
- the RIT score for this term
- the achievement percentile, a comparison with same-grade students across the US
- up to six terms of past scores
- growth between two terms, with a growth percentile that compares the change with similar students
- a projection onto the state test, the SAT or the ACT, if the school switched it on
The teacher's Student Profile report has more worth asking for: the standard error, the minutes the test took and the share of rapid guesses. A score from a test finished in twelve minutes is mostly a score about the twelve minutes.
The report cannot tell you whether one term's rise or fall of a few points is real, because in reading the error on a gain is larger than a typical year of growth from fifth grade on. Wait for the third and fourth data points.
It also cannot tell you what the school added. A high percentile describes the child and everything around them, in school and out, and the report has no way to separate the two.
Test scores and explaining an idea
I think MAP is a good instrument that gets asked for more than it can give. David Deutsch's account of knowledge, which I summarized in my guide to The Beginning of Infinity, is that understanding consists of explanations. A RIT score records which questions a student could answer. The evidence I trust that someone understands an idea is hearing them explain it in their own words and then answering a question about it.
Understand is my attempt at that for adults, so it is the wrong tool for a parent with a MAP report in hand. It is a voice tutor you can interrupt. It reads a text aloud word for word and stops when you ask a question, asks you to explain an idea back, and keeps a record of what you explained that you can read and correct. It has no courses, no problem sets, no spaced repetition and no Android app, and no trial has evaluated it. It is free for now.